FAO’s 6 November 2026 update showed a small drop in its main global food-price benchmark for October, but that should be read as a mixed market signal, not a clean all-clear for food affordability. FAO said the FAO Food Price Index averaged 133.9 points in October 2026, down 1.2% from September, while its Sugar Price Index rose 6.6% and reached its highest level since December 2024. FAO release
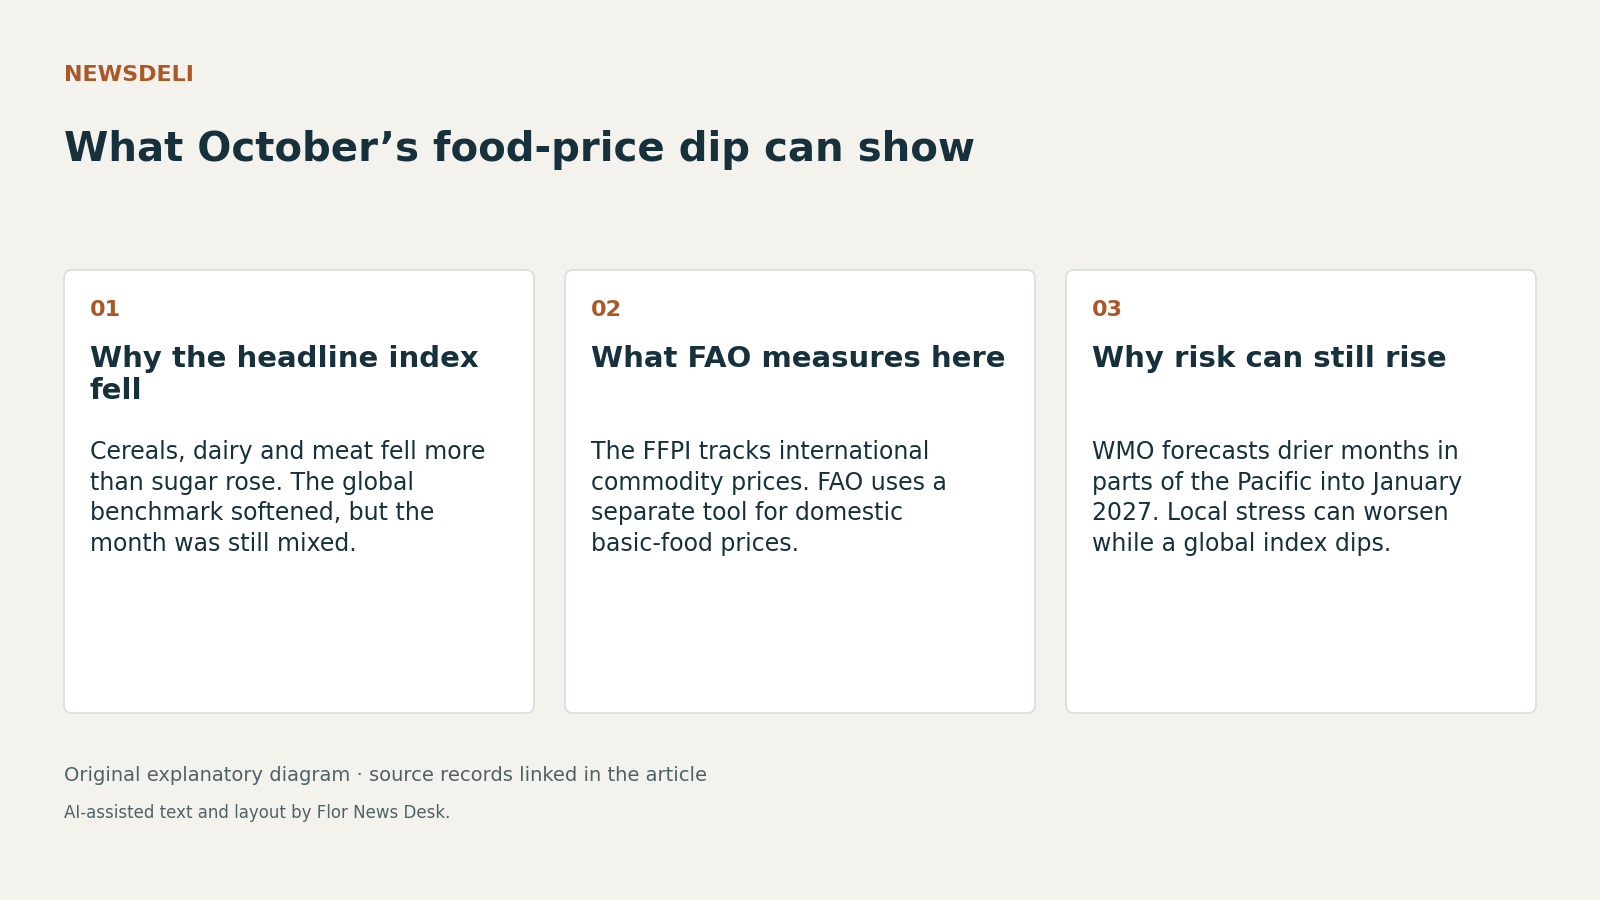
The first point is mechanical but important: the headline index fell because several larger commodity groups moved down at once. FAO said cereals fell 4.5% from September, dairy 1.1% and meat 1.2%, while vegetable oils rose 0.3%. That means October was not a story of food becoming uniformly cheaper. It was a story of declines in some widely traded categories outweighing a sharp rise in sugar. FAO also said the overall index remained 5.9% above October 2025, even after standing 16.4% below its March 2022 peak. FAO release
The second point is what the index measures, and what it does not. The FAO Food Price Index tracks international commodity prices. A separate FAO page for the same 6 November update says the Food Price Monitoring and Analysis Tool provides information on domestic prices of basic foods, mainly in developing countries, and is meant to complement FAO’s international market analysis. That is a built-in warning against treating the October FFPI move as a direct reading of shop prices, household purchasing power or whether assistance is reaching people. FAO statistics update page
A third point is that other broad commodity data moved in a similar direction in October, but not in an identical way. A World Bank Data Blog post published on 4 November 2026 said its Pink Sheet showed the non-energy index down 1.8% in October, with agricultural prices down 1.3% and food prices down 1.8%, while fertilizer prices rose nearly 1%. That broadly supports the idea of softer commodity prices in October, but it does not prove the same thing as FAO’s basket, and it does not show what happened in national retail markets. World Bank Data Blog
The climate context is why a softer global benchmark should not be mistaken for lower risk everywhere. In a news item published on 5 November 2026, describing an outlook issued on 23 October, WMO said a strengthening El Niño was expected to bring drier conditions from November 2026 to January 2027 across large parts of the north-west and south-west Pacific, while some equatorial areas were expected to be wetter than usual. The same page said Papua New Guinea, Solomon Islands, Vanuatu, Fiji and Tonga had already reported water shortages linked to low rainfall between May and October. WMO outlook report
Put together, those records support a narrower conclusion than many headlines invite. International traded-food prices can ease at the same time that regional weather risk intensifies. That is not a contradiction. A global benchmark averages across commodities and exporters; a regional climate shock can still tighten supply, strain water access or raise local prices in exposed places. WMO also said this El Niño had a high chance of becoming the strongest since 1950 and was expected to persist into March to May 2027, but that remains a forecast, not a measured food outcome. WMO outlook report
FAO’s own wider context points the same way. In the 6 November release, FAO cited a same-day cereal brief forecasting 2026 world cereal production at 2,999 million tonnes, still the second-highest on record, while also saying 41 countries or territories were estimated to require external food assistance, unchanged from the previous count. Those facts can sit together because aggregate supply, benchmark prices and actual access are different questions. To know whether October’s dip translates into relief, readers would still need current domestic price series, national stock data and evidence on aid financing and delivery that these records do not provide. FAO release