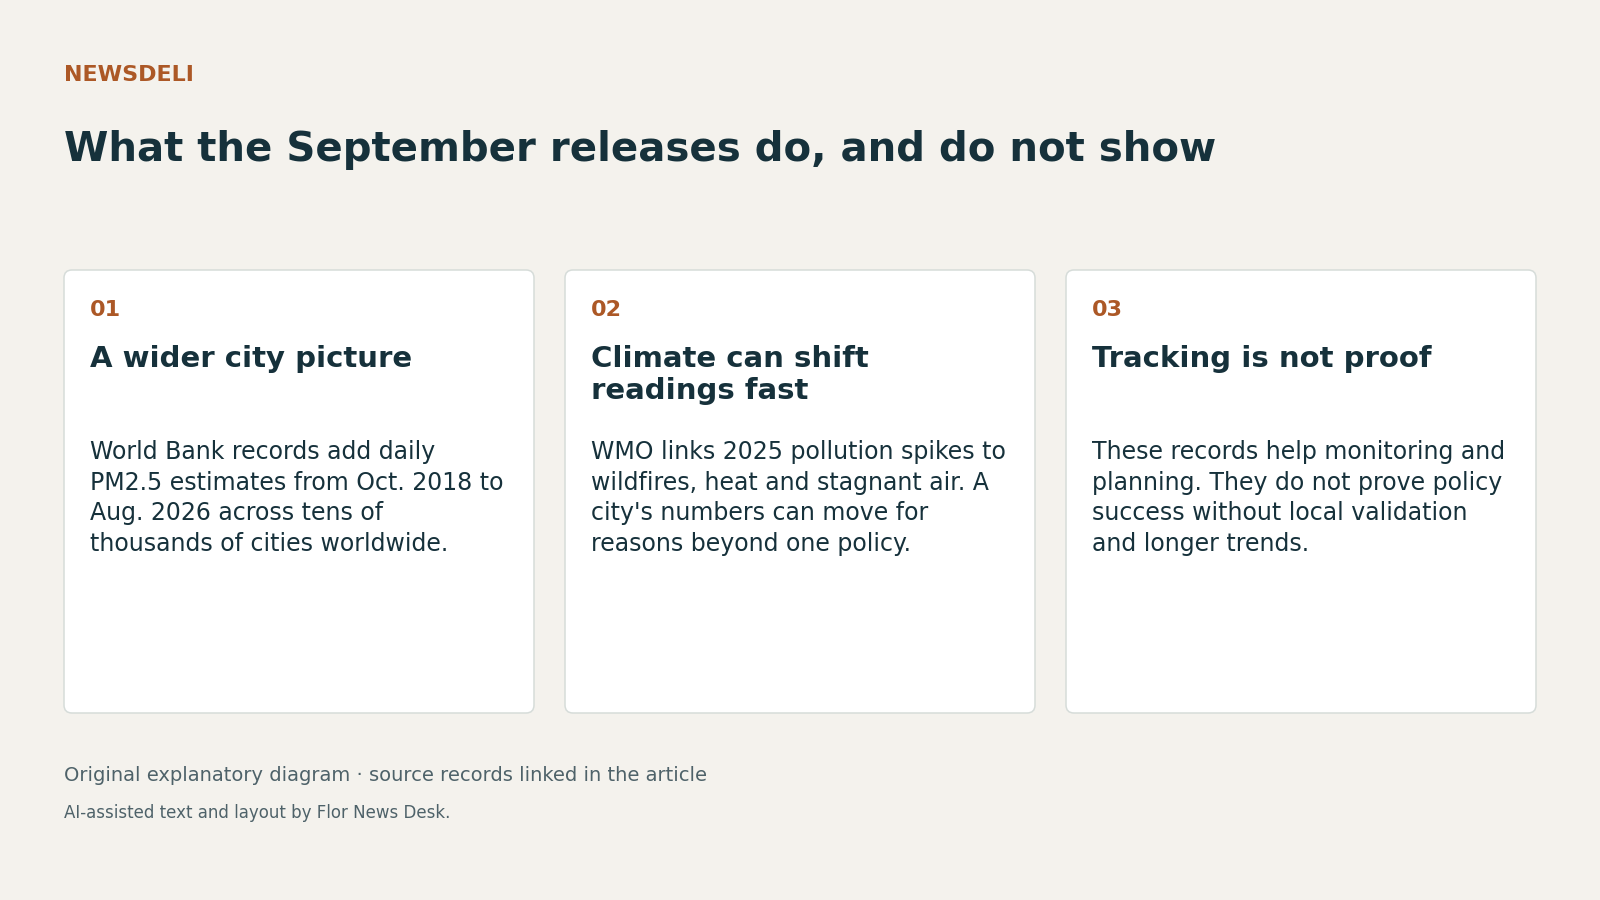
On 25 September 2026, the World Bank’s open-data blog introduced an expanded daily city-level PM2.5 dataset, and the accompanying catalog page describes city or metropolitan estimates running from October 2018 through August 2026 World Bank blog World Bank data catalog. Read beside the WMO Air Quality and Climate Bulletin No. 6 and WMO’s same-day summary WMO news release, the practical shift is simple: far more cities can now track likely exposure day by day. What these records do not establish is which local clean-air policies have already worked.
The World Bank material matters because it promises scale where many cities lack dense monitor networks. The blog says the estimates combine satellite data, ground-monitoring reports, weather data, emissions estimates and geographic information, while the catalog lists sources including the IQAir network, ESA TROPOMI, Copernicus ERA5 and EDGAR World Bank blog World Bank data catalog. For a health or planning team, that is an information upgrade even before any new law is passed. A city can at least see a longer daily history and compare present conditions with earlier periods.
The WMO records explain why that extra temporal detail could matter. The bulletin page says its sixth edition gives an overview of notable air-quality and climate aspects in 2025 and adds evidence of strong links between air quality, climate change and health impacts WMO bulletin page. WMO’s news release adds examples: PM2.5 in 2025 was above the long-term average in northern Canada, parts of the Russian Federation and western-central Africa because of increased fire activity, and heat, stagnant conditions and strong sunlight promote ground-level ozone formation WMO news release. That means city pollution readings can swing for climate and fire reasons that sit outside one mayor’s transport policy.
That is also why the new dataset should not be mistaken for a policy scorecard. The retrieved World Bank records do not provide validation metrics, neighbourhood-level representativeness or a confirmed public update lag; the blog mentions one-week-lag updating and extension to other pollutants as capabilities the framework could support, not as completed public coverage World Bank blog. They also leave an unresolved scale question, with the blog saying more than 32,000 cities and the catalog saying more than 34,000 World Bank blog World Bank data catalog.
The analytical takeaway is narrow but useful. If a city announces a new vehicle rule and its estimated PM2.5 then falls, that sequence alone would not prove the rule succeeded. Based on the source record, a stronger claim would need at least three extra pieces: local validation against monitors, a clear intervention date, and a sustained decline long enough to separate policy effects from wildfire smoke or weather-driven pollution shifts. None of the September records supplies that outcome evidence.
A WHO in Viet Nam news page at a URL dated 29 September 2026 shows how institutions are already treating better air data as an operational input rather than as proof of success. WHO in Viet Nam said around 200 officials and experts gathered in Ha Noi for the Second National Conference on Combating Air Pollution and Improving Air Quality in Viet Nam, and that the country is moving to implement a 2026-2030 national action plan approved in November 2025 WHO in Viet Nam page. The same page says participants discussed governance, financing, low-emission zones, forecasting and evidence-based policymaking. But the retrieved page does not display a publication date in the text or measure cleaner air outcomes.
So the September releases look most valuable as measurement infrastructure. The World Bank records widen daily urban PM2.5 coverage, and WMO is explicitly calling for better observations of pollutants and aerosols, including fine particulate matter and ground-level ozone WMO bulletin page. That helps cities ask better questions. It does not yet answer the hardest one, which is whether any particular fix is measurably working.